Monitor Servers/Serices Via Grafana & Prometheus
Focusing Grafana and Prometheus For years since 2014 when I was working for Sony Mobile, and built a service monitor soltion for them.
These days, I built a dashboard for my homeserver and services again, let me record it, a bit long.
Frist look: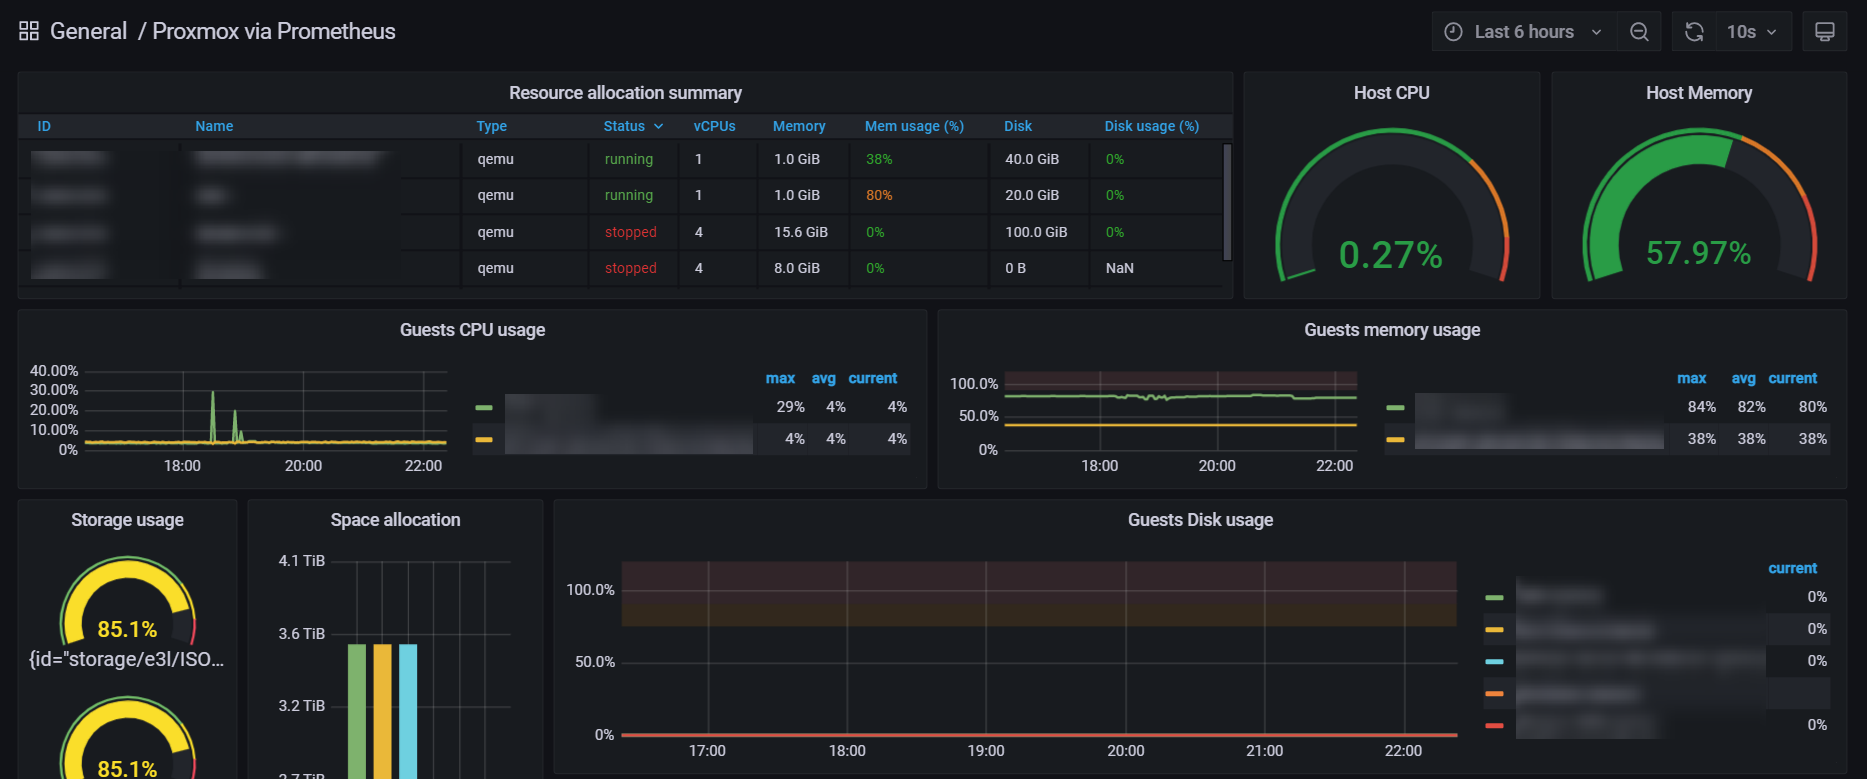
Install Prometheus & Grafana
Install them on my home server via docker
Install Grafana
1 | docker run -d --name=grafana -p 3000:3000 grafana/grafana-oss:8.1.3 |
prepare prometheus.yml at somewhere
1 | global: |
Install Prometheus
1 | docker run -p 9090:9090 -v /a_path_for_prometheus/prometheus.yml:/etc/prometheus/prometheus.yml prom/prometheus |
Have a look Servers
Grafana (http://your-server:3000/), you will be asked to set username and password first time.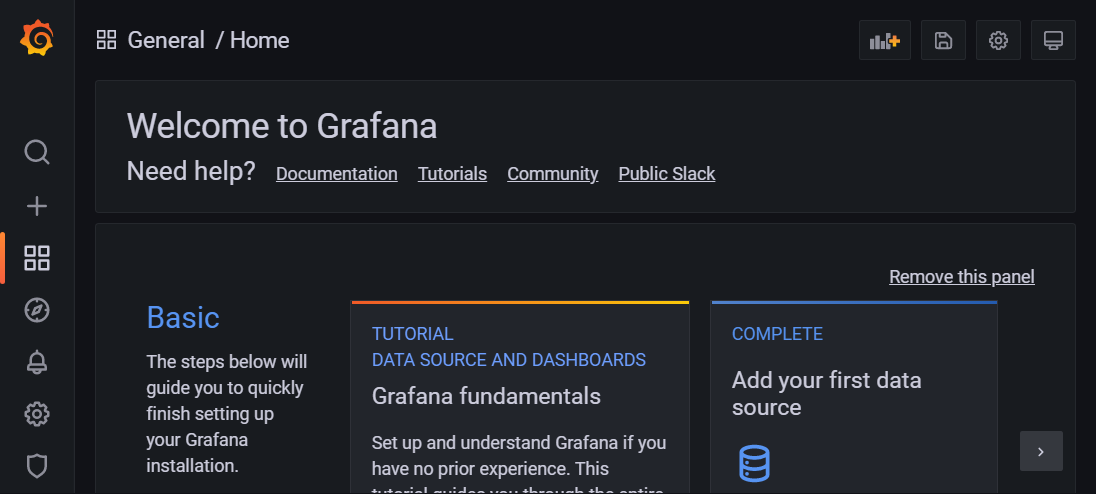
Prometheus (http://your-server:9090/)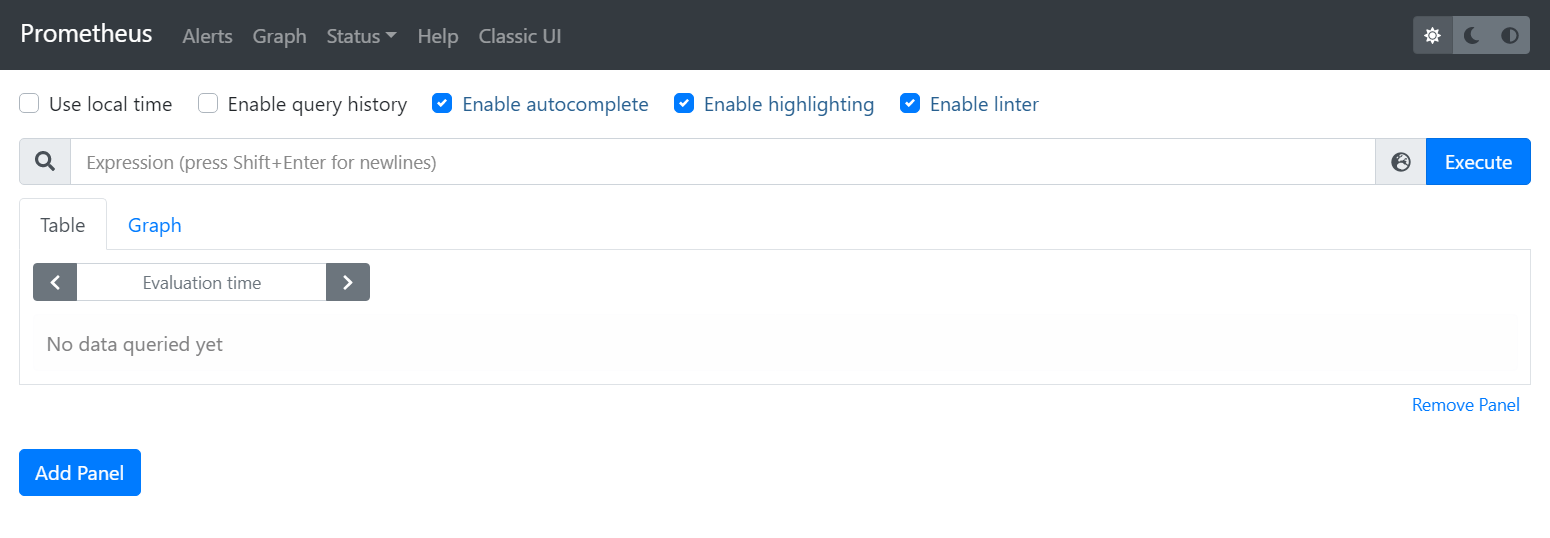
Install Prometheus Exporters and Setup
Proxmox(PVE) Server
Login your PVE server console
Create an api user type
1 | veum roleadd Monitoring |
Add users named “monitoring” and “prometheus”
1 | pveum useradd monitoring@pve --comment "The ICINGA 2 monitoring user" |
assign role to above users
1 | pveum aclmod / -user monitoring@pve -role Monitoring |
Install python and pip, via apt or other way as you wish
1 | apt-get install -y python python-pip |
Install prometheus-pve-exporter
1 | pip install prometheus-pve-exporter |
Setup systemd service
1 | [Unit] |
Config file
1 | mkdir -p /etc/prometheus-pve-exporter/ |
update pve.yml as following:
1 | default: |
Start prometheus-pve-exporter service
1 | systemctl daemon-reload |
Added a job to Prometheus Server
1 | scrape_configs: |
Restart Prometheus Server
Check the export server and it on Prometheus server
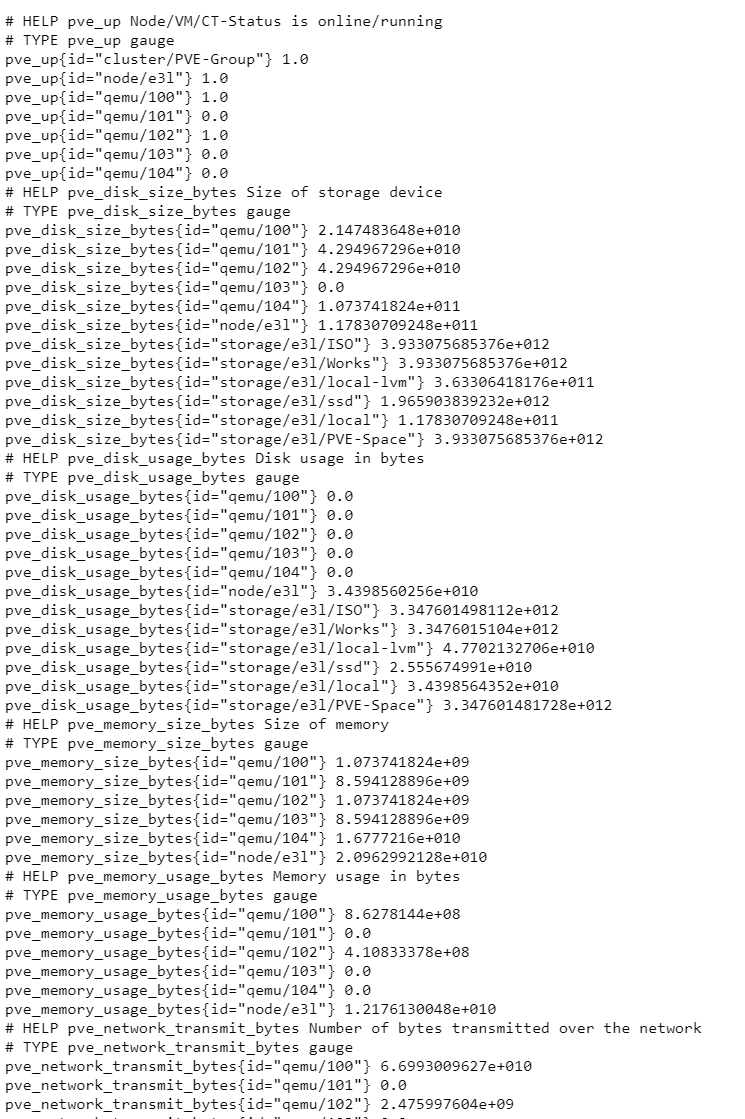
open browser, goto http://xx.xx.xx.xx:9221/pve, then you can see:
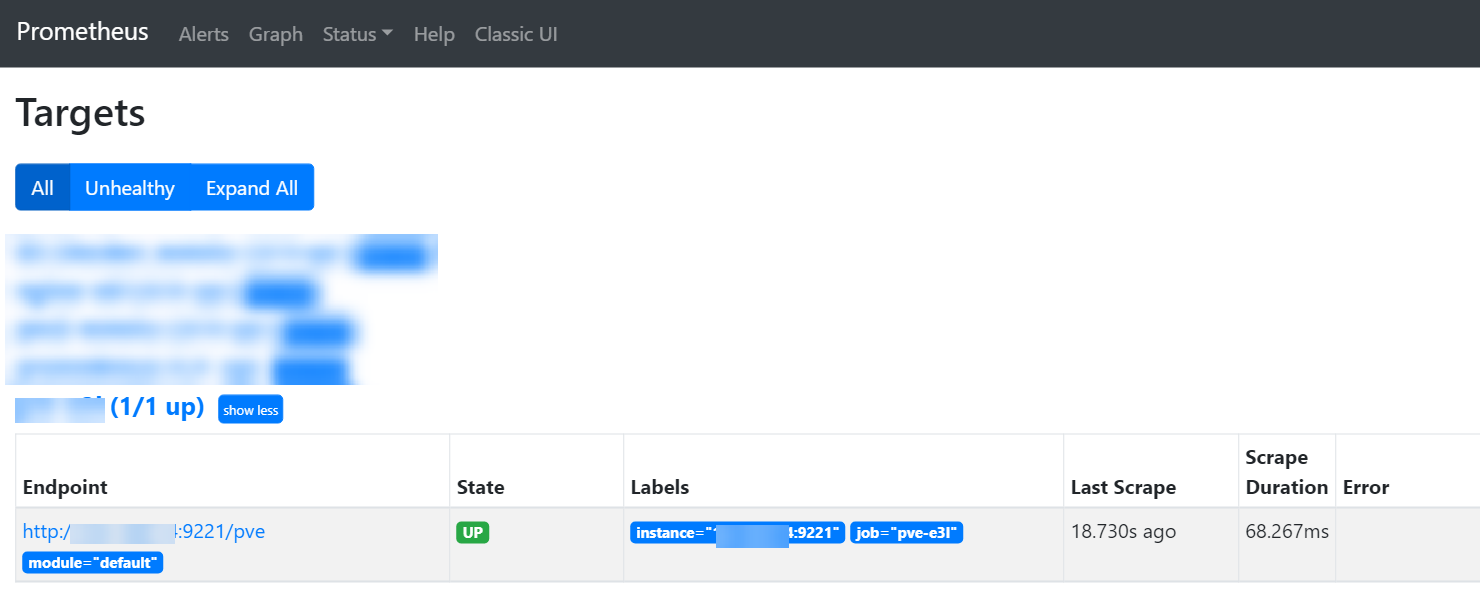
access your Prometheus http://xx.xx.xx.xx:9090/targets, it should be listed.
Setup/Import Grafana Dashboard
If you want to copy or modify a dashboard from other, find it on Grafana Hub (https://grafana.com/grafana/dashboards/)
Because we are using prometheus service(collects metrics from server, only choose the “prometheus”, but others )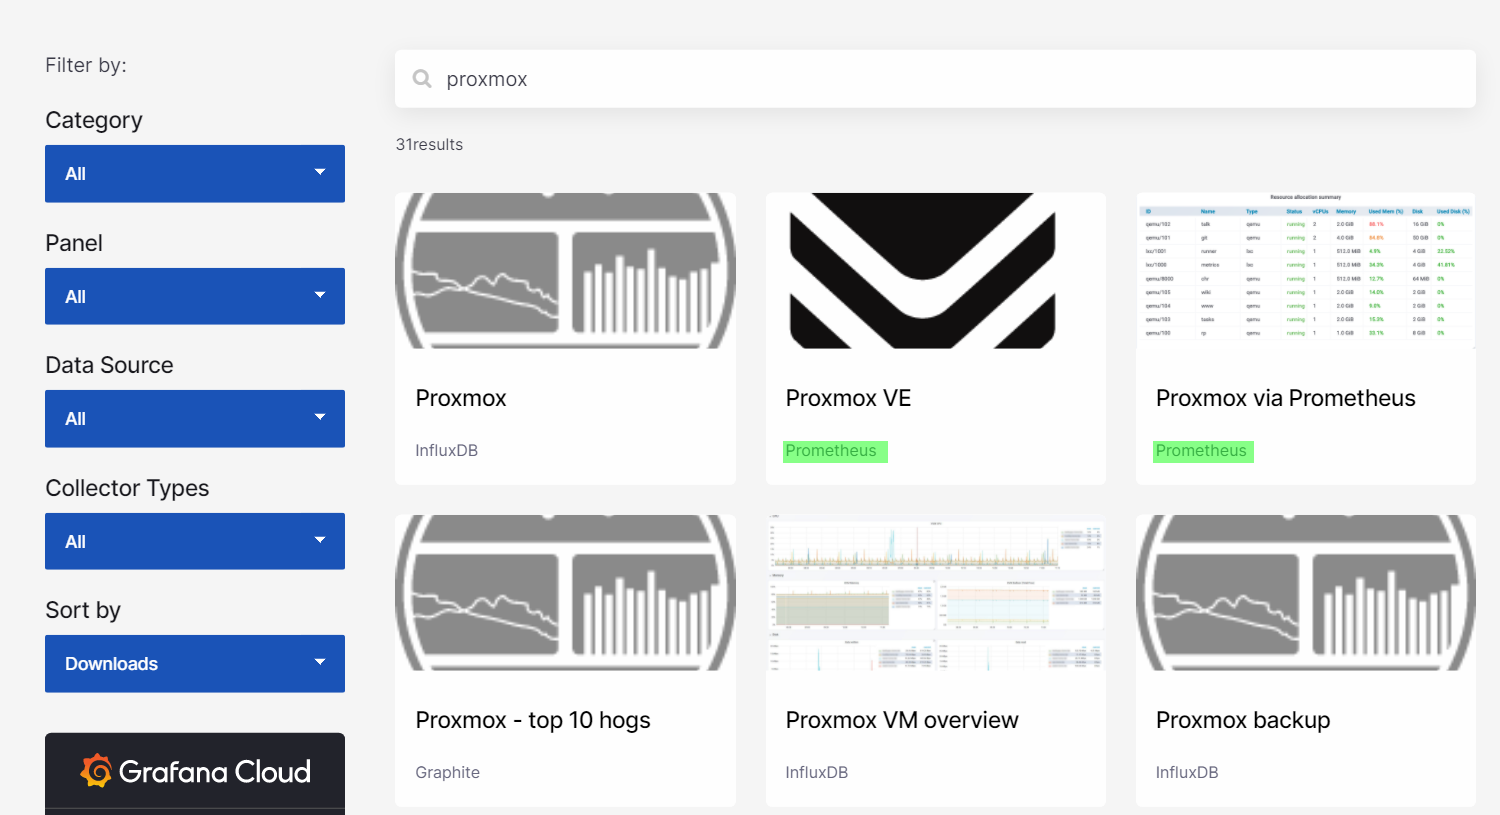
find one your favorite, copy it’s ID, or copy the json file.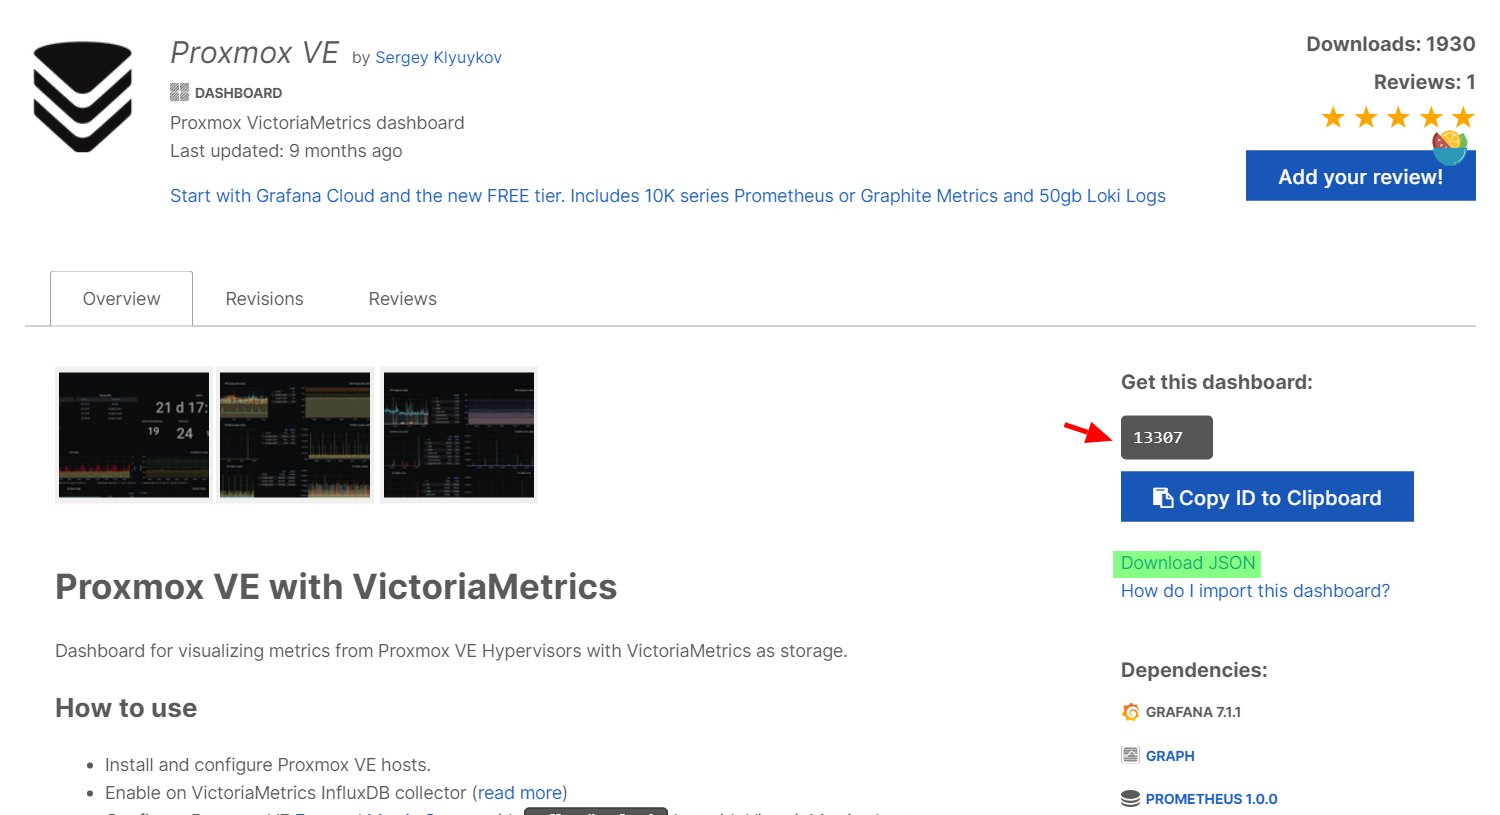
Goto the management page of your Grafana, and import it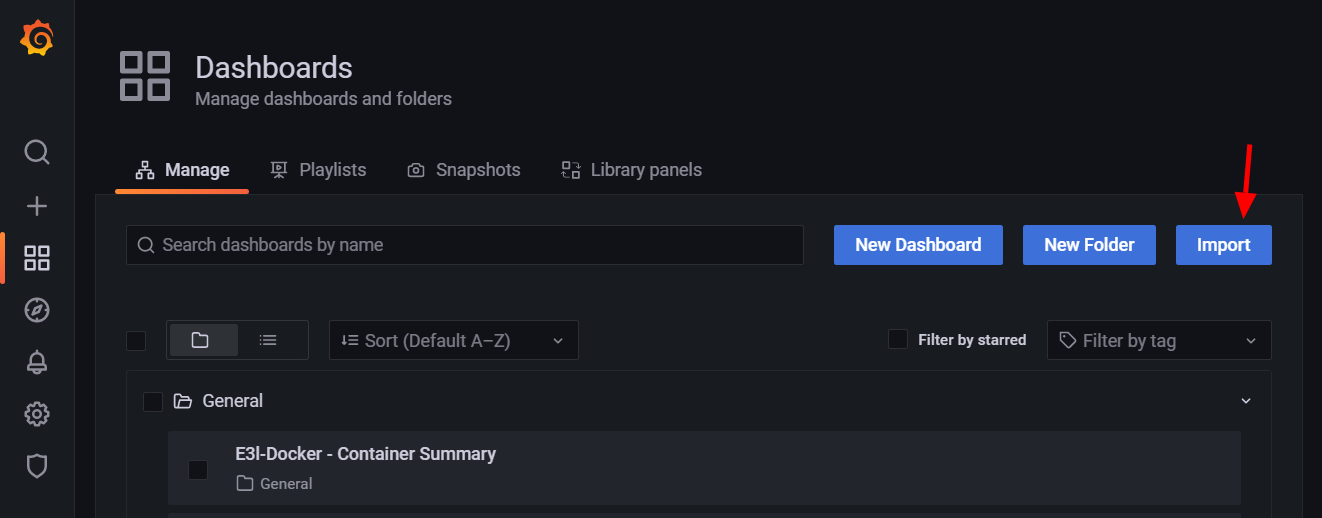
paste the ID, or paste the json content above, then load.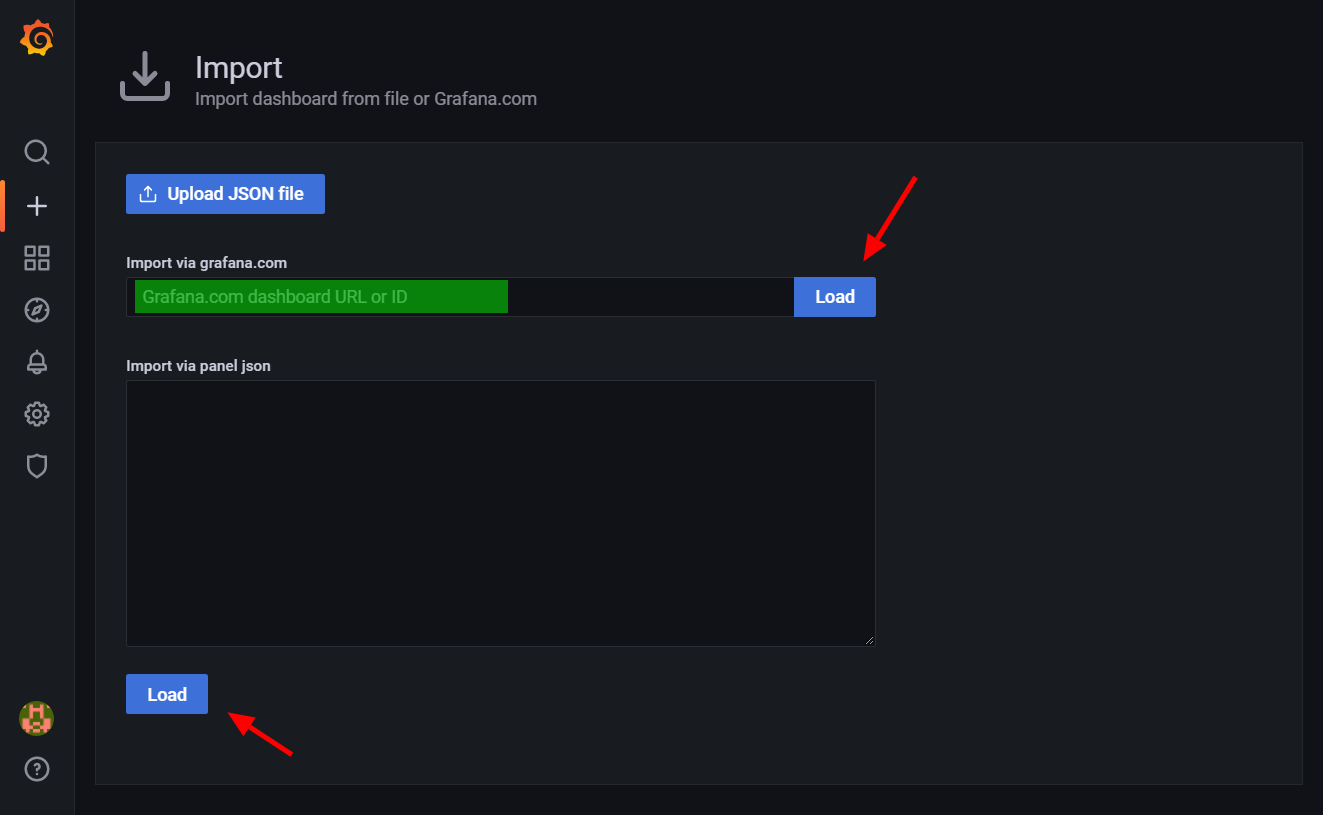
Choose your server, it will filter fitable servers automatically.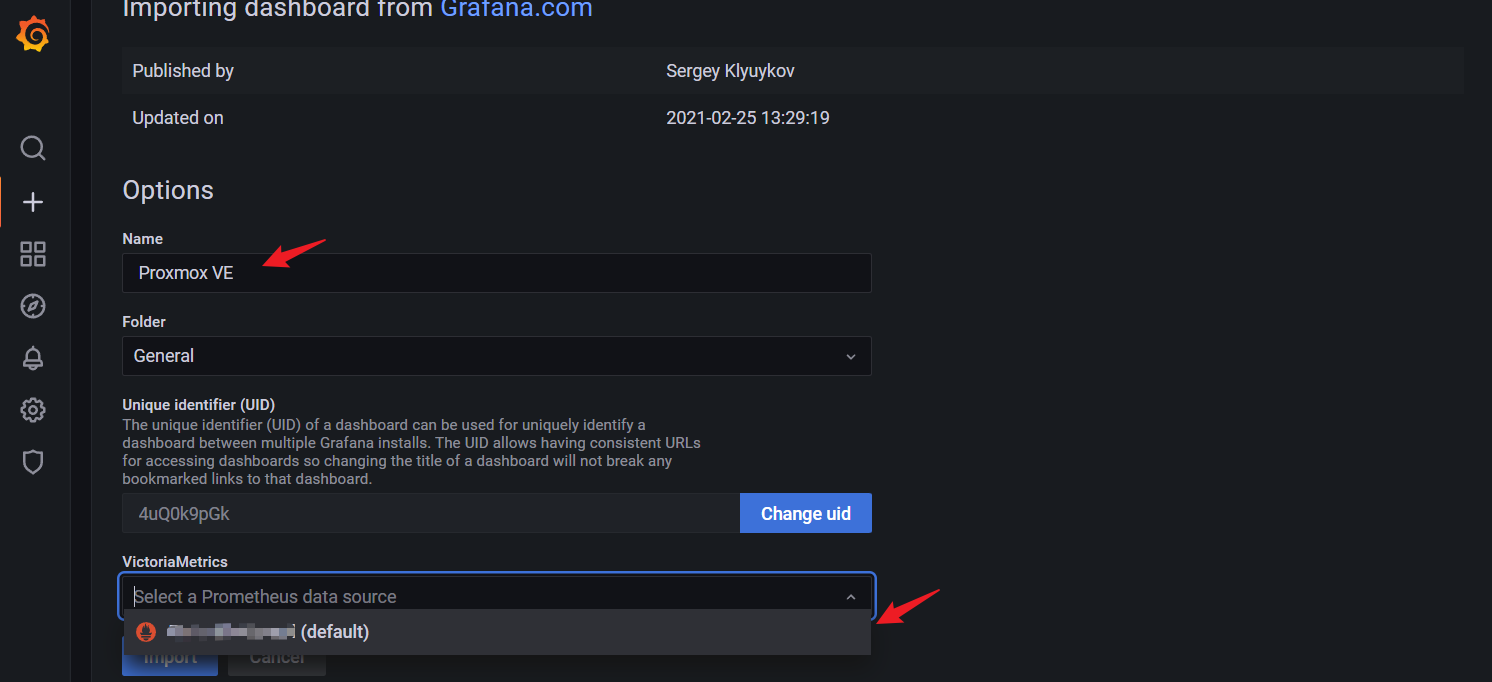
Then, you can modify as you wish, wow, get a rest now :).
Exporters/Dashboard for PM2, Nginx, Docker
If you wana monitor a server or service, just find google the name with prometheus exporter, maybe someone have share it and find a dashboard exist on Grafana hub, otherwise you have to create it yourself.
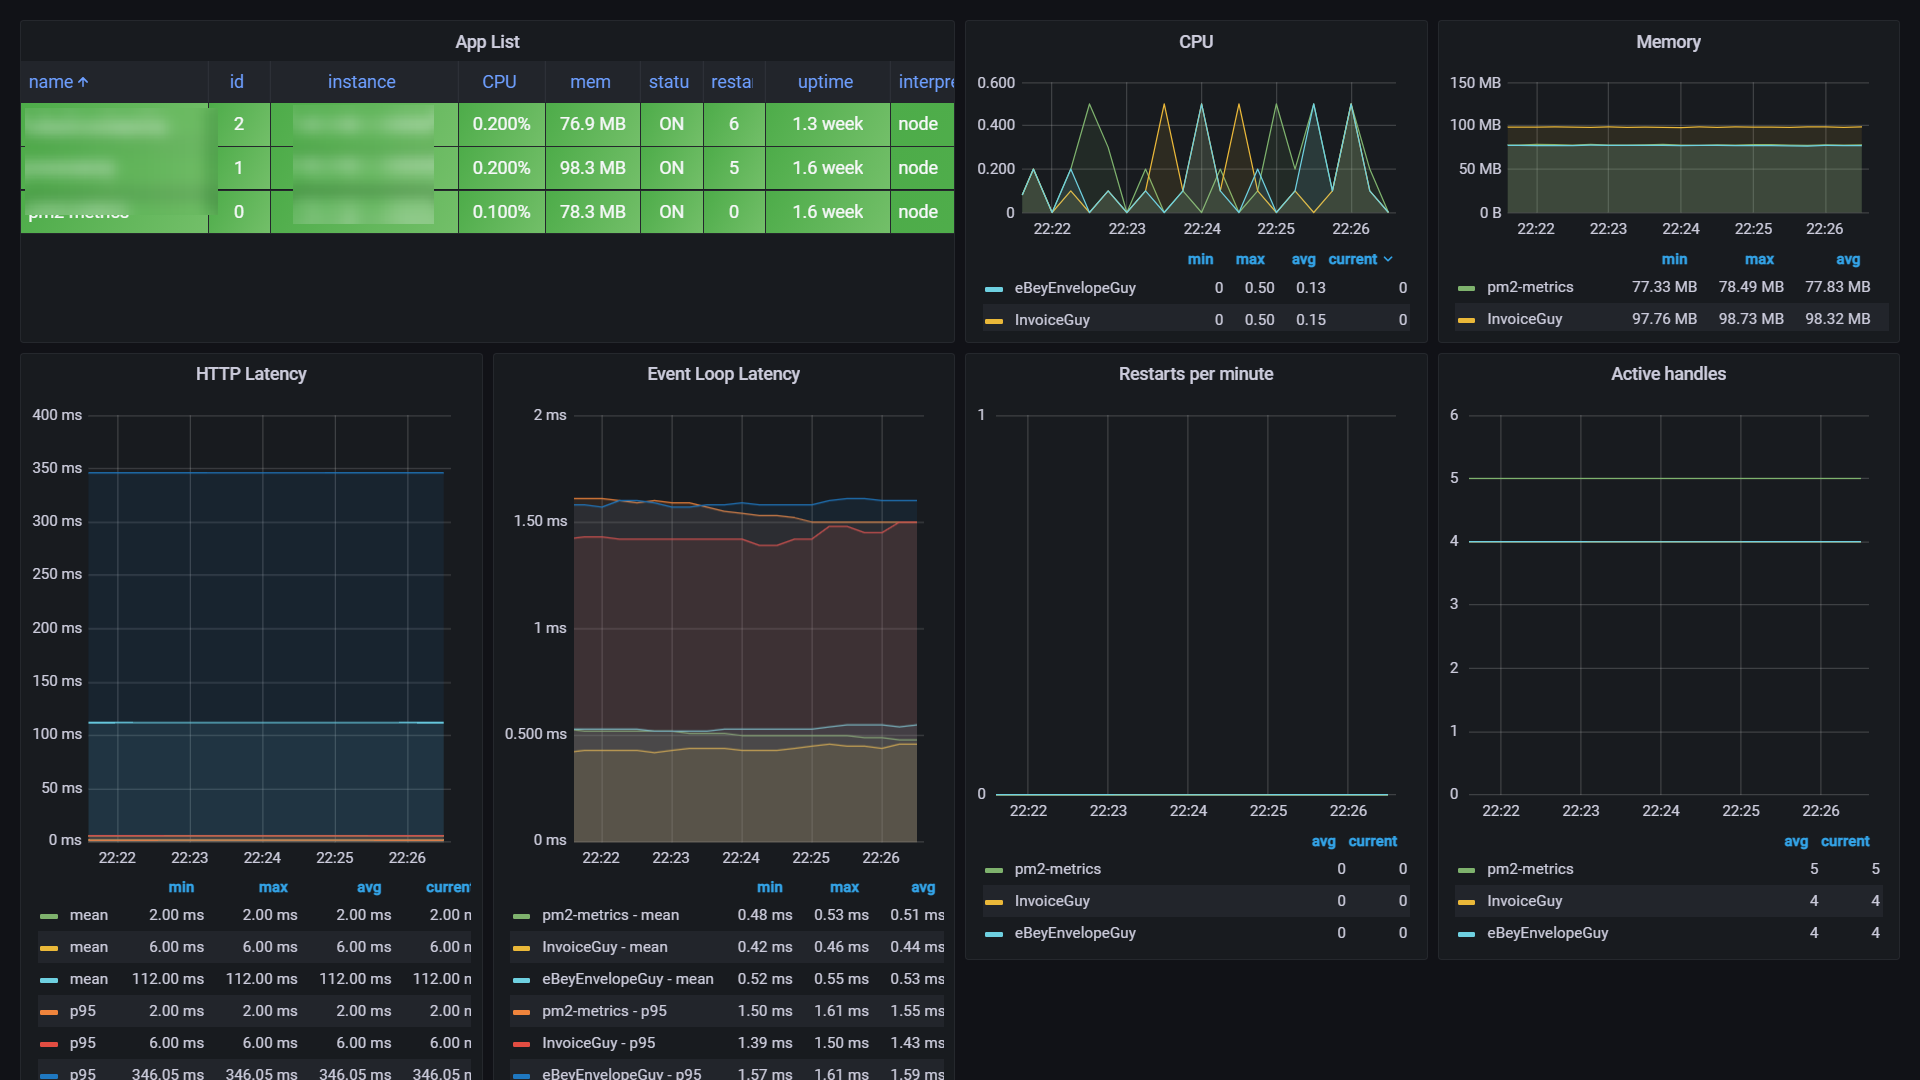
PM2
Following https://github.com/saikatharryc/pm2-prometheus-exporter
Install it as a module gobally.
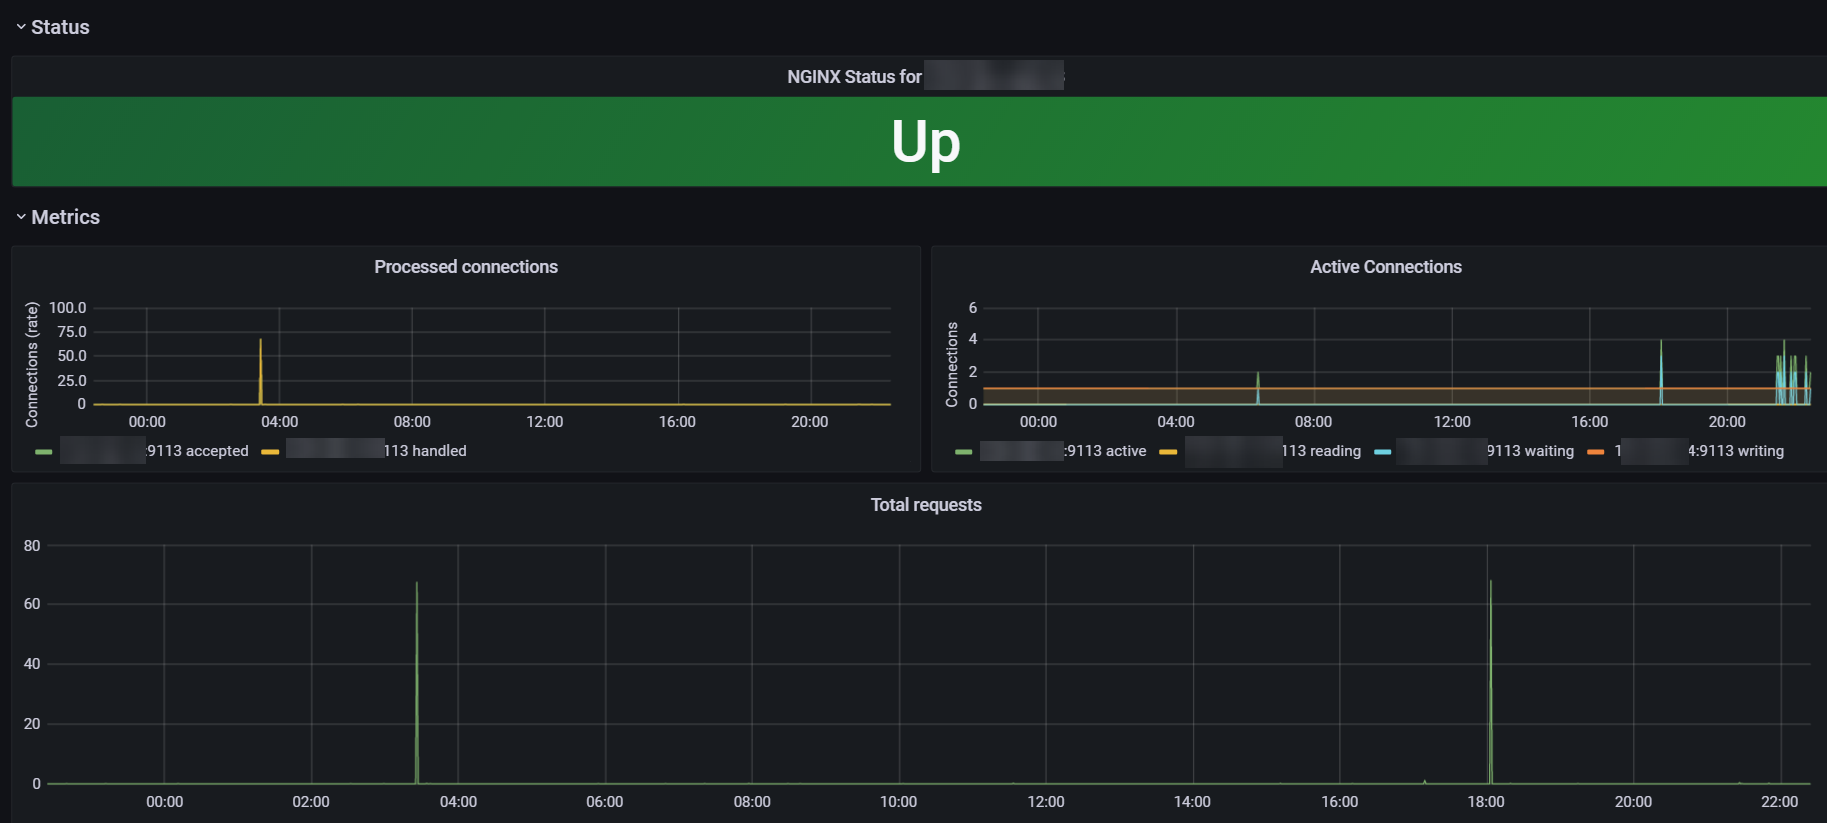
Nginx
Following https://github.com/nginxinc/nginx-prometheus-exporter
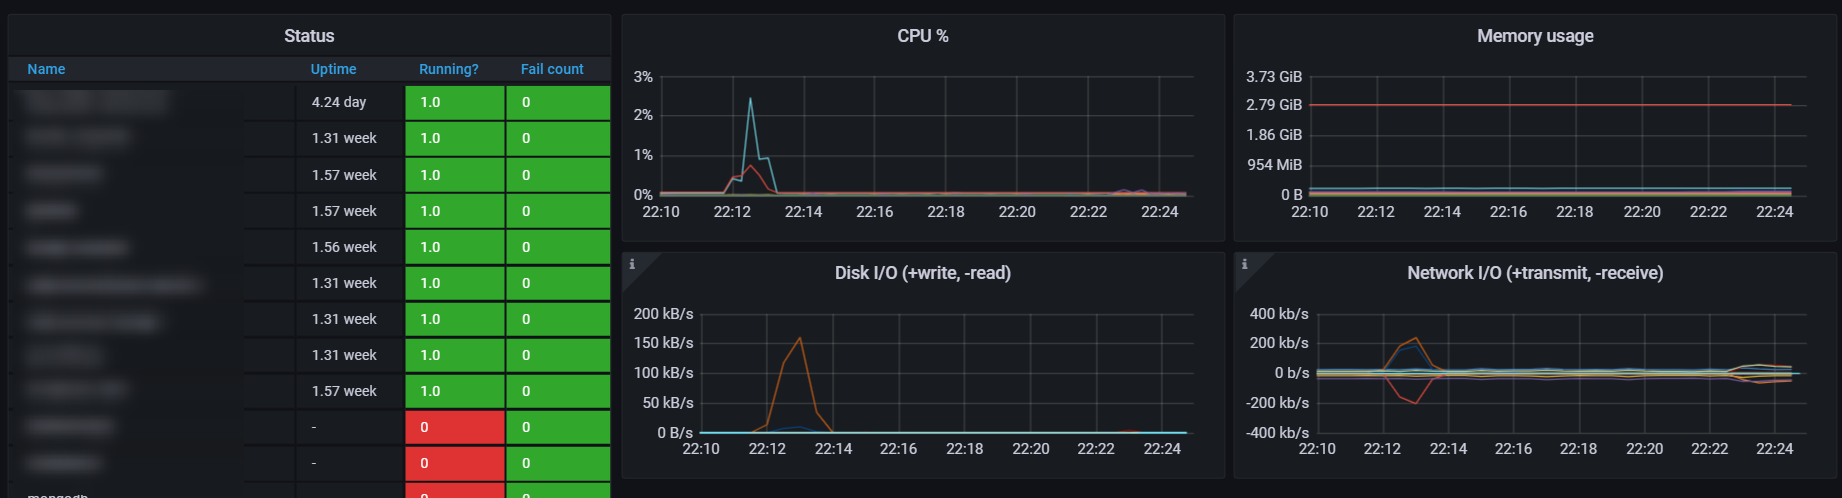
Docker
Following https://github.com/prometheus-net/docker_exporter
Reflection
I was spending weeks building dashboards(same solution as above) for company projects years ago, nowadays only cost an afternoon(Thanks guys who opensource these exporters and dashboards).